Tabeen Raoof Portfolio
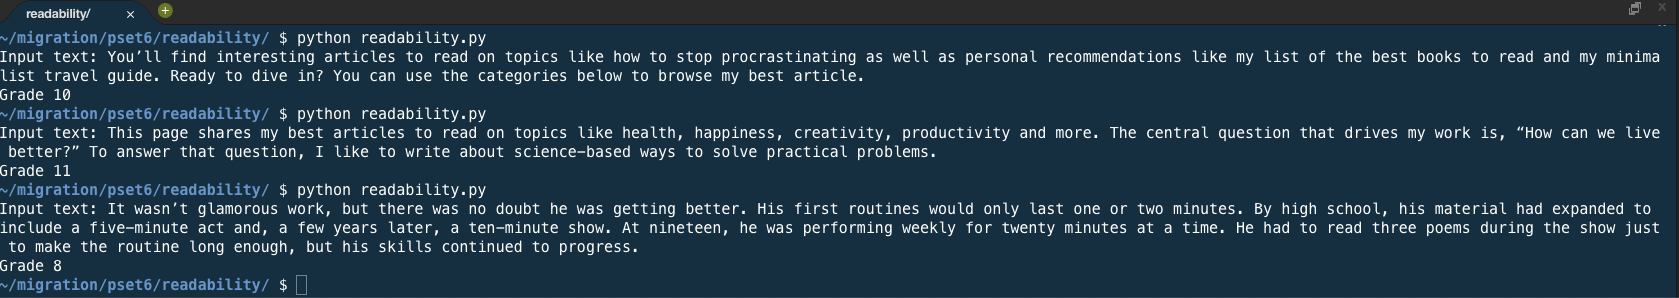
- Classifies a piece of text (paragraph, etc.) into 16 grades based on its difficulty level
- The program determines the difficulty level based on numbers of letters in each word, numbers of words and number of sentences in the text.
- It makes the computation using the Coleman-Liau index.
Languages & Frameworks: Python
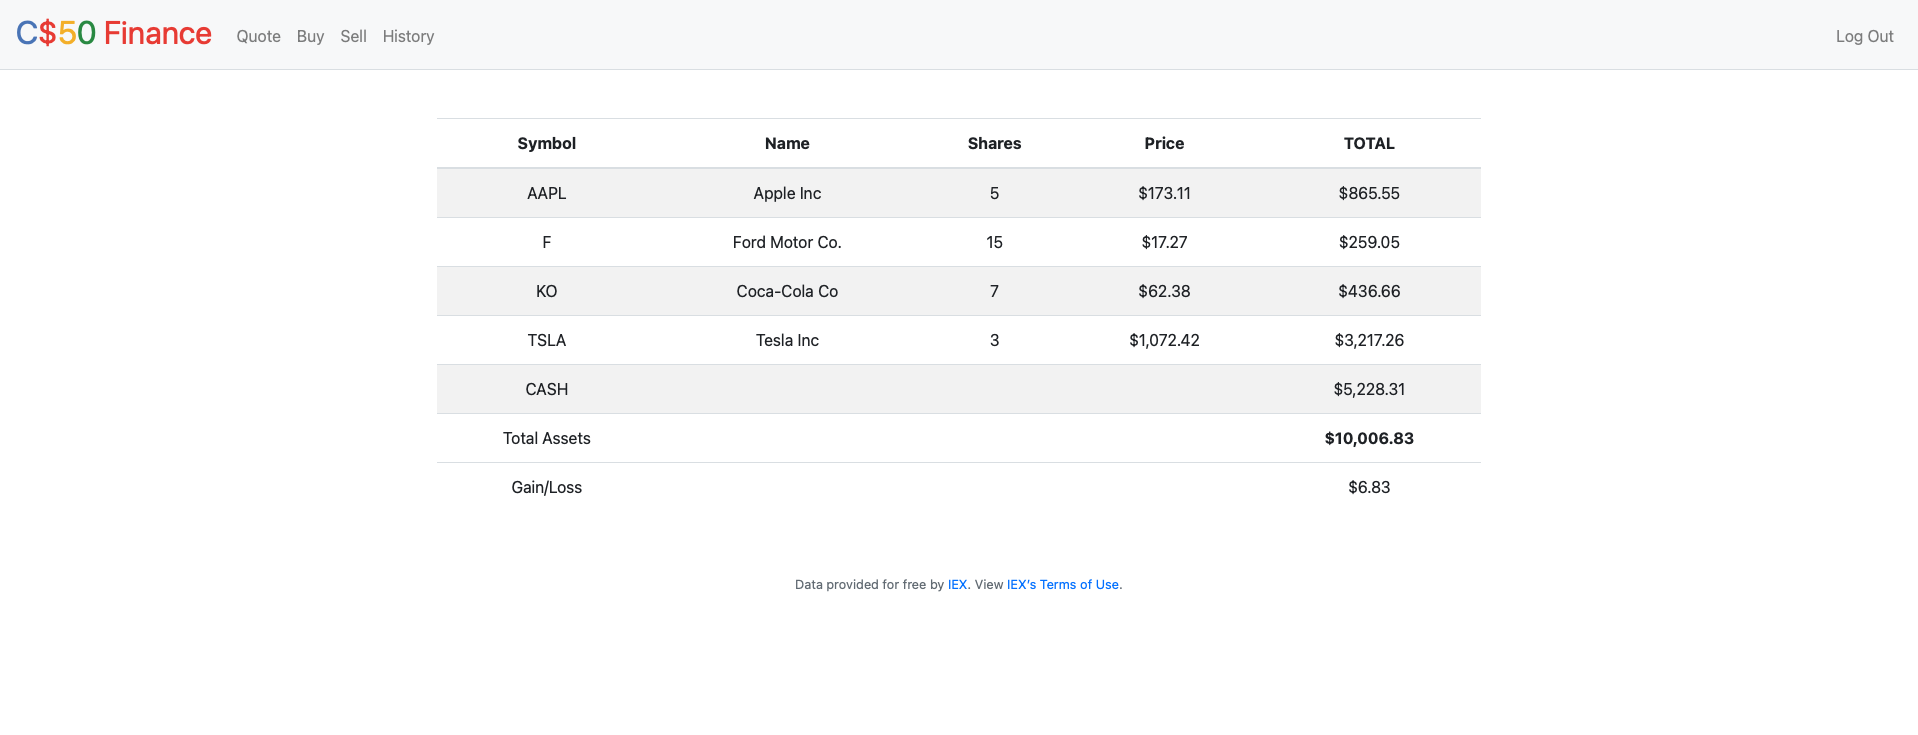
Project 2: Stockbroker Simulator
- Web application simulate an online stockbroker where users can open accounts and buy and sell stocks
- The application shows a real time stock price using an API
- Users cannot invest real money but each new user gets a virtual $10k to use for investment
Languages & Frameworks: Python; Flask; SQL
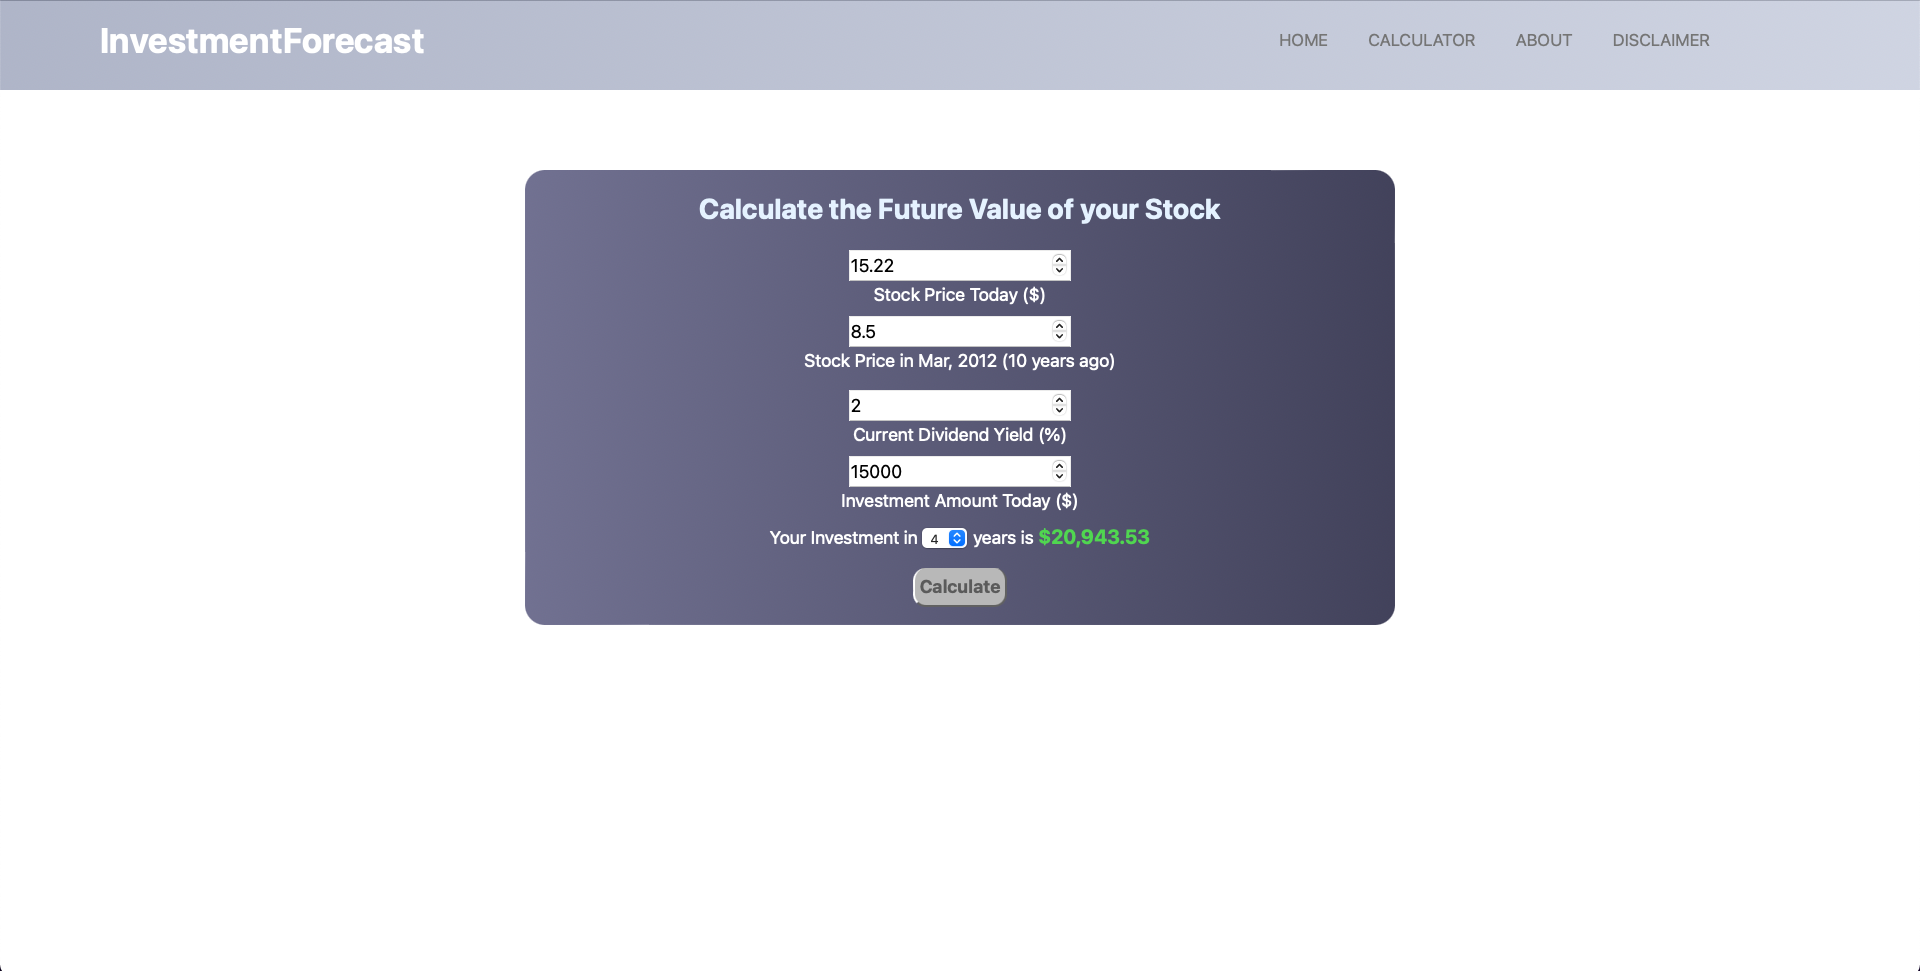
Project 3: Investment Forecast
- Web application to forecast investment growth for a stock or asset
- It calculates the forecast based on historical values
- The calculator makes very rough estimates and by no means accurate
Languages & Frameworks: JavaScript; Flask; HTML; CSS
- This is a project to find the person that stole a duck (CS50’s duck to be specific)
- The thief should be looked for using SQL to query through multiple tables of large and small datasets.
- The queries used were from simple to more complex including nested queries, joining 2-3 tables etc.
Languages & Frameworks: SQL
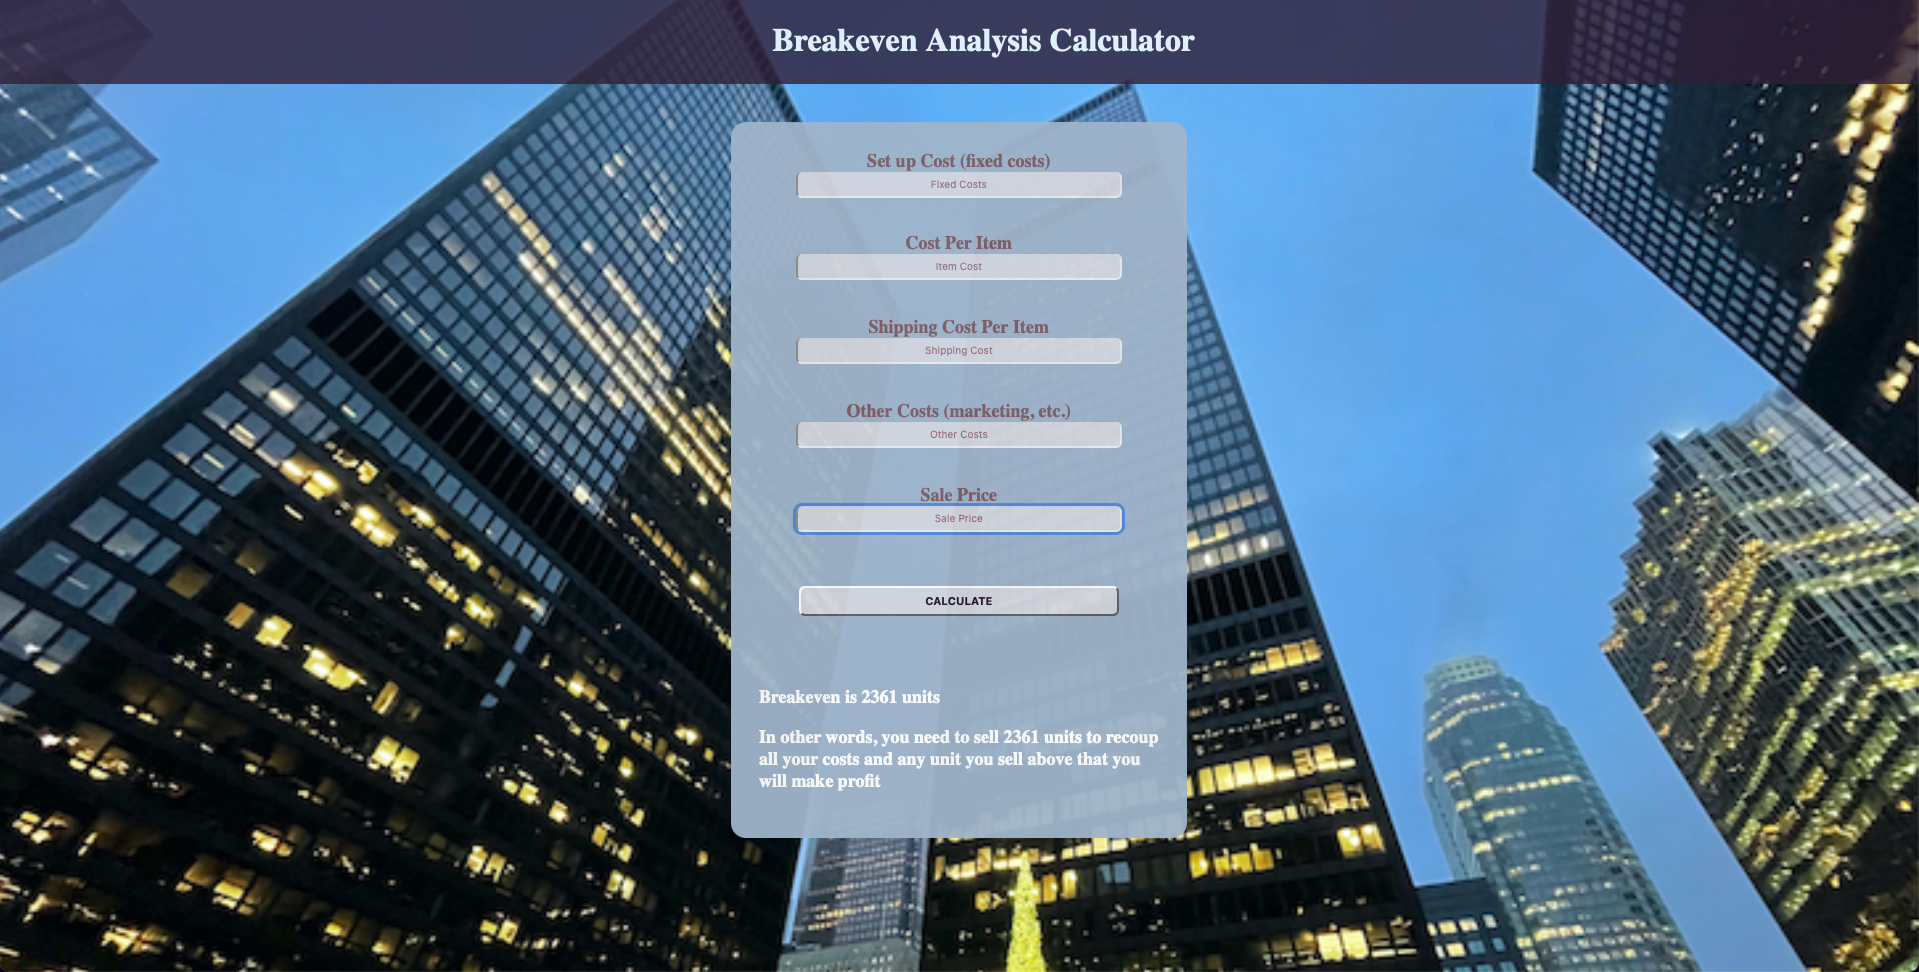
Project 5: Breakeven Calculator
- Web application to calculate a breakeven point for a product
- The calculator makes use of multiple calculations based on user input of different costs and item price to calculate the number of units to be sold to recoup all costs
- This is the final project for the course
Languages & Frameworks: Python; Flask; HTML; CSS
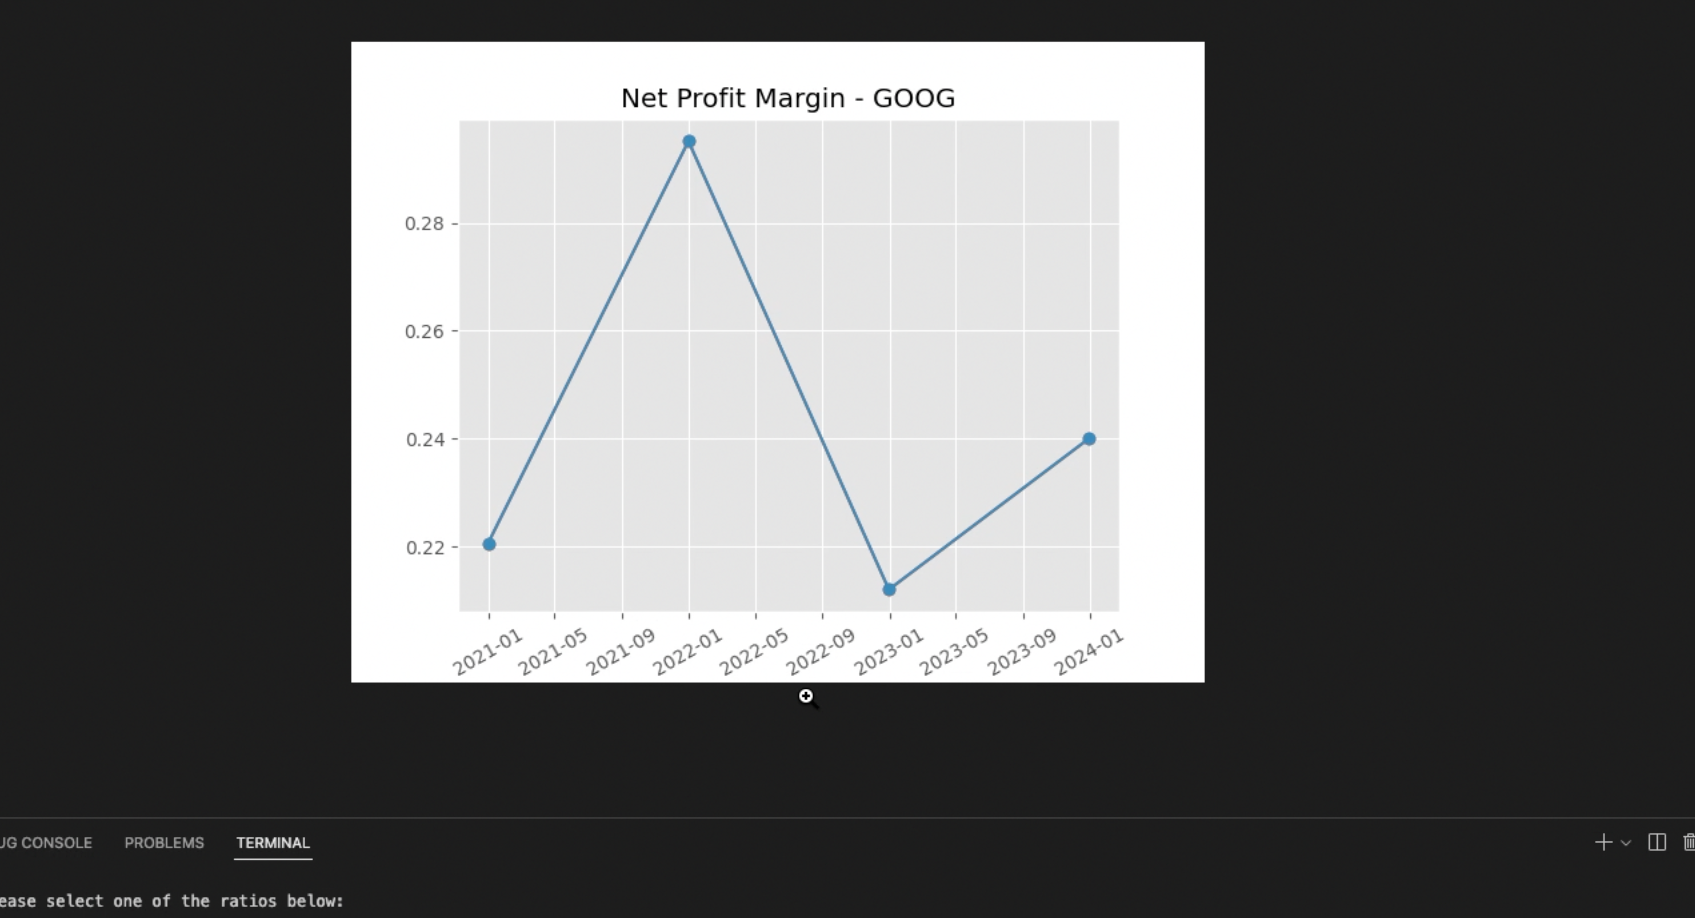
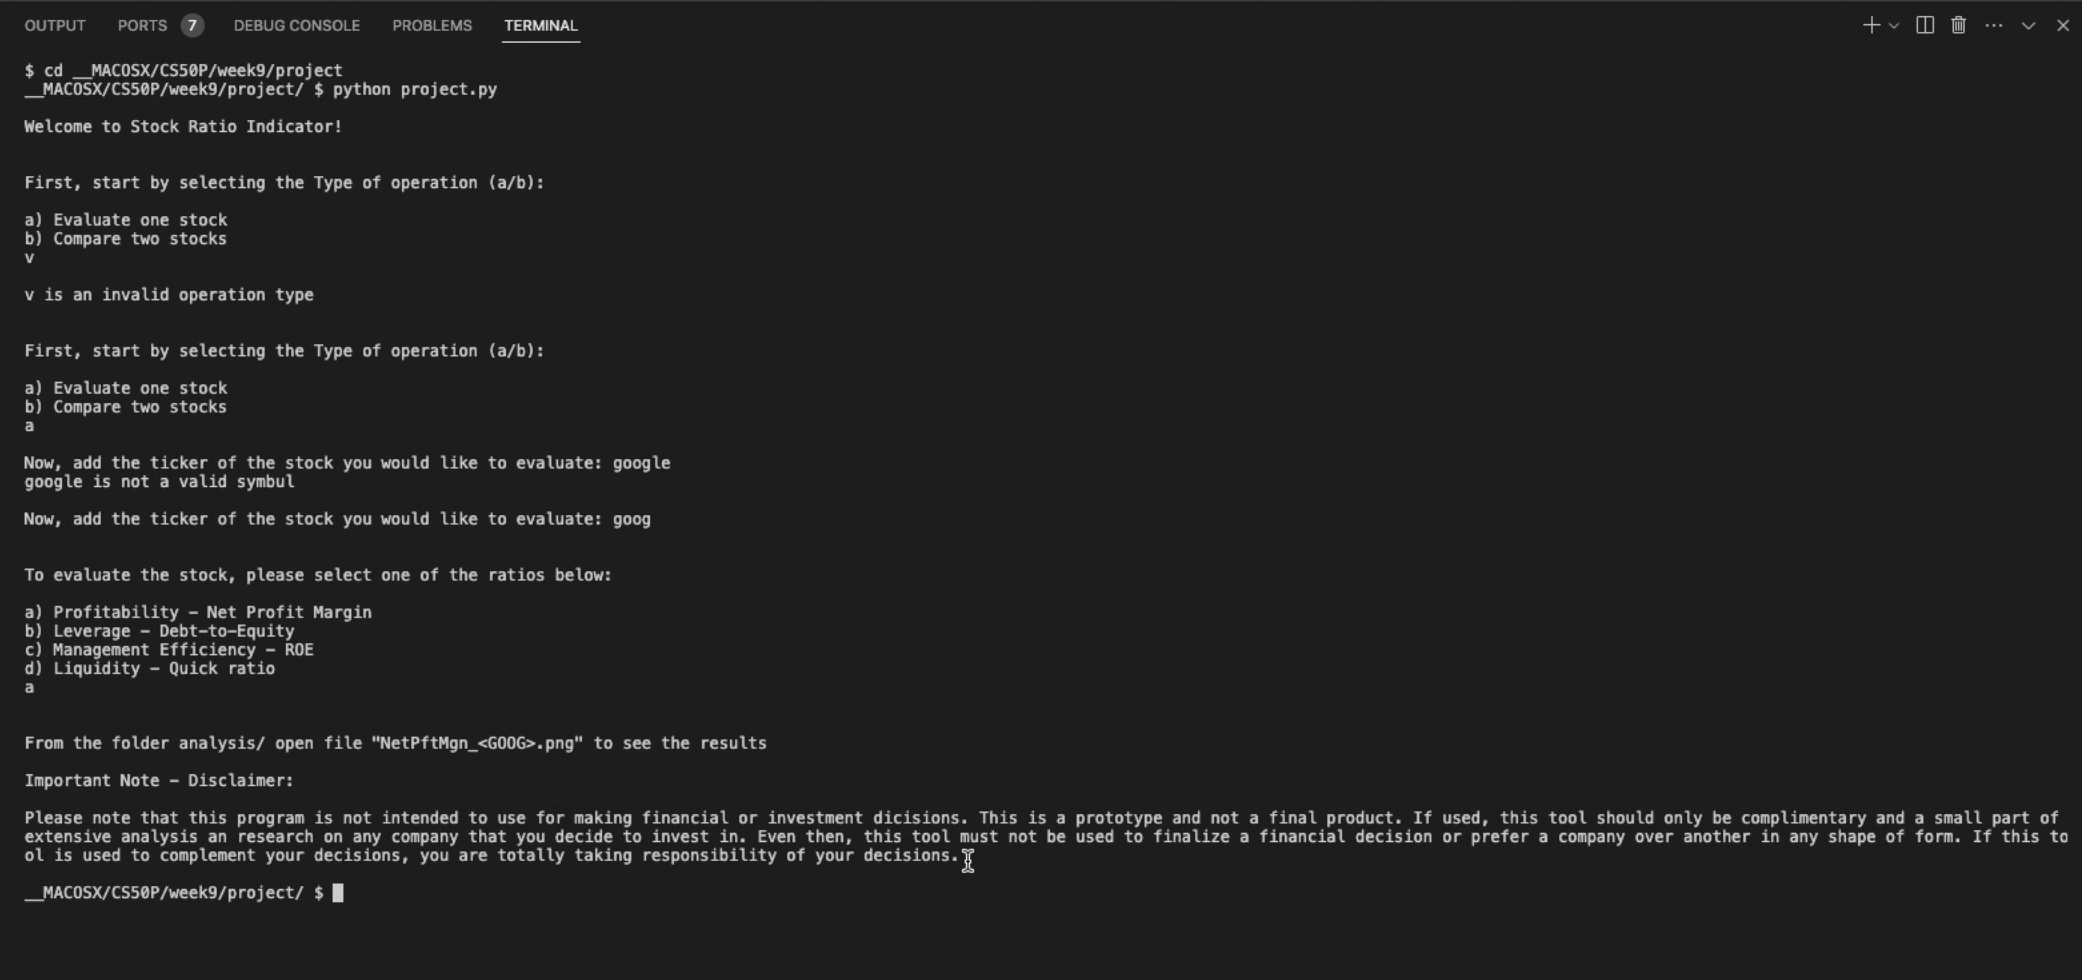
Project 6: Stock Ratio Indicator
- This program will evaluate four fundamental stock ratios. It will allow the user to select between two types of operations: evaluate one stock or compare two different stocks. The user will then be prompted to select the stock ticker/s. Once the stocks are selected, the program will prompt the user to also select one of the four different ratios available. The the output is four years of data fro the selected ratio presented on a graph.
Languages & Frameworks: Python; matplotlib; unit testing